Creating a random graph from a string
October 25, 2019
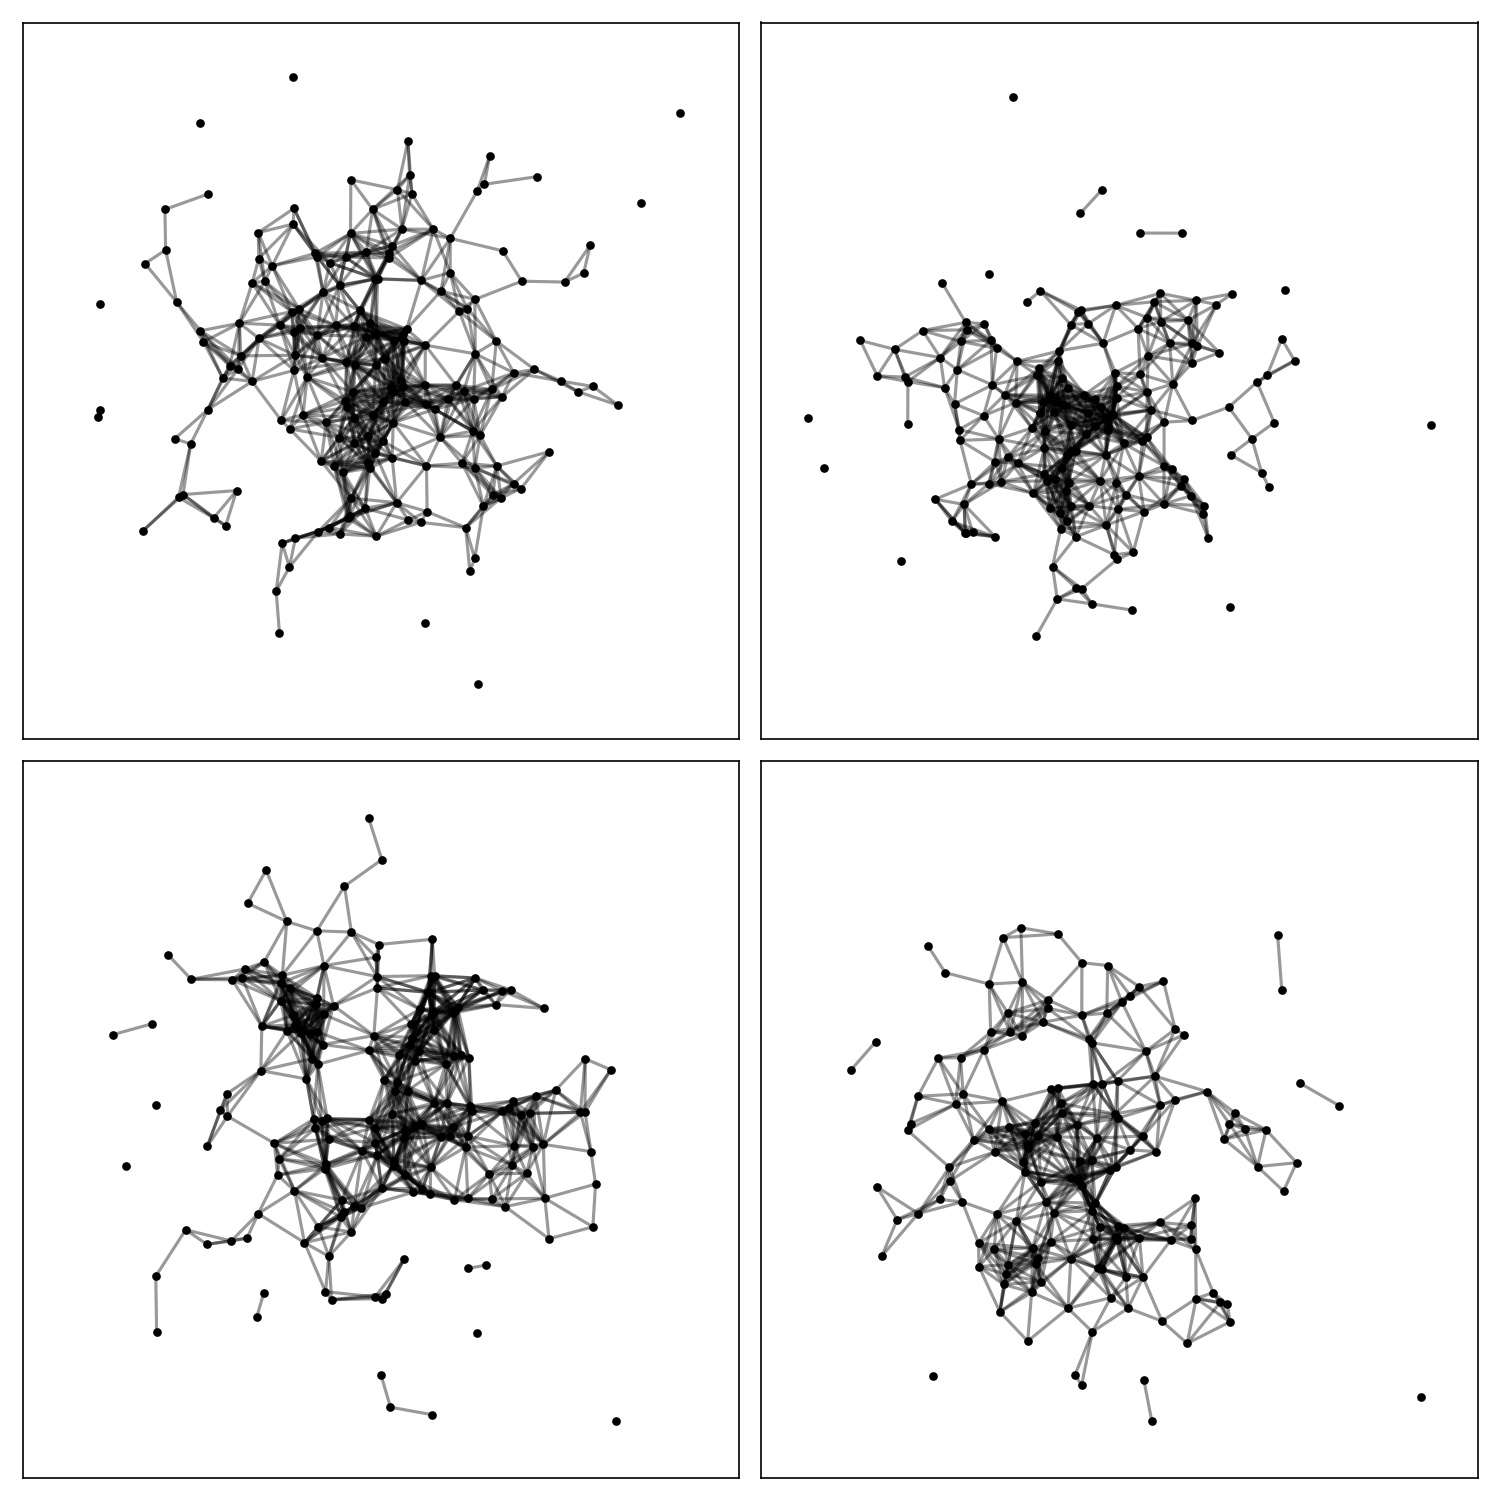
I have been toying around with the idea of creating art using pseudorandom number generators. In this post, I talk about a script that takes as input a string and outputs a random graph. Here are some examples:

In summary, I transform the string to ASCII character by character, add up all these values to get an integer, I plug it as a seed for numpy’s pseudorandom generator, and I construct a graph by sampling normal distributions and joining nearby neighbors. I will go through the code function by function. Here’s the whole code in gist, if you’re in a rush.
String to integer #
The core of the idea is to transform a string to an integer in a deterministic way. I started by using Python’s own hash function, but found out quickly that it behaved (pseudo)randomly between different sessions. I finally settled for transforming each character in the string to its ASCII code, and then add up all these to form an integer.
def parse_string_to_int(string):
    chars_as_ints = [ord(char) for char in string]
    string_as_int = sum(chars_as_ints)
    return string_as_int
Notice that Python has its own way of transforming characters to ASCII code: the ord function.
This way of encoding strings to integers comes with a funny consequence: anagrams render the same graph. There’s also a high chance for collisions (strings that end up in the same integer, and thus the same graph). It hasn’t happened with my friends’ names so far, though.

As a small mathematical note, if \(\Sigma\) is the alphabet and \(\Sigma^*\) is the set of all possible words, there are plenty of functions \(f\colon \Sigma^{ *}\to \mathbb{Z}\) to experiment with. This one happens to be commutative in the strings, but we could think about many others that wouldn’t be.
Integer as seed #
Now that we have a way of encoding strings as integers, we can use these integers as seeds in a pseudorandom number generator. If you’re new to the world of computing, it might come as a surprise that random numbers don’t exist (or, at least, can’t be created using a computer unless you have a Geiger counter or other cool stuff). Computers generate so-called pseudorandom numbers: numbers that appear to be random, but are actually being created in a deterministic fashion. These algorithms start with a number, called the seed, and transform it in intelligent ways to create a very large sequence of (seemingly) random numbers.
Thus, you have a way of deterministically getting a sequence of random numbers by just specifying the seed at the start. In numpy, this can be made by passing a positive integer to np.random.seed:
import numpy as np

np.random.seed(1)
print(np.random.randint(0, 10, size=(1, 15)))


np.random.seed(1) # to re-start the sequence.
print(np.random.randint(0, 10, size=(1, 15))
The output of this code will be array([5, 8, 9, 5, 0, 0, 1, 7, 6, 9]) both times.
So, we can use the string as a seed by converting it to an integer and passing it to numpy’s random generator:
int_seed = parse_string_to_int(string)
np.random.seed(int_seed)
Sampling the random points #
Once we have a deterministic way of getting random numbers according to the string, we can sample points from a normal distribution with mean 0 and variance 1. I start by getting the amount as a random integer between 100 and 200, and then I sample said amount in each axis independently:
def create_random_points(string=None):
    if string:
        int_seed = parse_string_to_int(string)
        np.random.seed(int_seed)

    amount = np.random.randint(100, 200)
    random_points_x = np.random.normal(0, 1, (amount, 1))
    random_points_y = np.random.normal(0, 1, (amount, 1))

    random_points = np.concatenate([random_points_x, random_points_y], axis=1)

    return random_points
Notice that there’s plenty of room for experimentation: you could go for another distribution, you could go for more points, you could sample different distributions in each axis, you could go 3D… I settled for the normal distribution because of the symmetric, triangular patterns that emerge.
Joining points #
I decided to fix a radius \(r\) around each point, and then join said point to all the neighbors that are in the closed ball of radius \(r\) (using the Euclidean metric). I compute all the lines I need to construct by sweeping through the points twice:
def get_lines(random_points, radius=0.5):
    lines = []
    for i, point_1 in enumerate(random_points):
        for j, point_2 in enumerate(random_points[i:]):
            if i == j:
                continue

            if np.sqrt(sum((point_1 - point_2) ** 2)) < radius:
                lines.append(np.array([point_1, point_2]))

    return lines
There’s also plenty of room for experimentation here. I went for a fixed radius of \(1/2\) (since I considered appropiate given that we were sampling from normal distributions of variance 1), but you could easily go for a different, dynamic radius for each point. You could also go for different metrics.
Plotting #
In order to make it easy to create grids and subplots, I implemented a function that takes an axis and plots the random points and corresponding lines according to a string. It gets the random points corresponding to the string, it gets the lines, figures out the limits in \(x\) and \(y\) and plots the graph:
def plot_in_axis(ax, seed, radius=0.5, size=3):
    random_points = create_random_points(seed)
    lines = get_lines(random_points, radius)
    xlims = [np.min(random_points[:, 0]) - radius, np.max(random_points[:, 0]) + radius]
    ylims = [np.min(random_points[:, 1]) - radius, np.max(random_points[:, 1]) + radius]
    lims = [min([xlims[0], ylims[0]]), max([xlims[1], ylims[1]])]

    for line in lines:
        ax.plot(line[:, 0], line[:, 1], "-k", alpha=0.4)

    ax.scatter(random_points[:, 0], random_points[:, 1], c="k", s=size)
    ax.tick_params(
        top=False,
        bottom=False,
        labelbottom=False,
        right=False,
        left=False,
        labelleft=False,
    )
    ax.set_xlim(*lims)
    ax.set_ylim(*lims)
As you can see, I settled for plotting the graph in a square given by the maximum spread on both directions.
Putting everything together with click #
For the end product, I wanted a script plot_graph.py that would take the string as argument. In order to do so, I used click. With click, you can define arguments and options for your Python script really easily. This is the main function of plot_graph.py:
def clean_string(string):
    for symbol in [" ", ",", ";", ":", ".", "\n", "\r", "\t"]:
        string = string.replace(symbol, "")
    return string

@click.command()
@click.argument("string", default=None, type=str)
@click.option("--radius", default=0.5, type=float)
@click.option("--size", default=5, type=int)
def main(string, radius, size):
    _, ax = plt.subplots(1, 1, figsize=(10, 10))
    plot_in_axis(ax, string, radius, size)
    ax.set_xlabel("\n" + string, fontsize=15)
    plt.savefig(f"{clean_string(string)}.jpg", format="jpg", dpi=150)
    plt.show()

if __name__ == "__main__":
    main() # pylint: disable=no-value-for-parameter
To clean the string, I implemented a simple function that takes out spaces, tabs, newlines and some punctuations.
Now you can call this string by just writing python plot_graph.py "The string you want to transform here". Be wary: it will overwrite any photos with said string as name in your folder. You can also modify the radius of the connections and the size of the nodes by passing the options --radius= and --size= respectively.
Conclusion #
I implemented a small script to take strings, transform them to integers, and use those integers to sample random points in the plane. After that, I joined points that were a given fixed radius apart. There’s plenty of room for improvement or experimentation. Here’s a link to a gist with the full code.